


| Index | Value | Chg | %Chg |
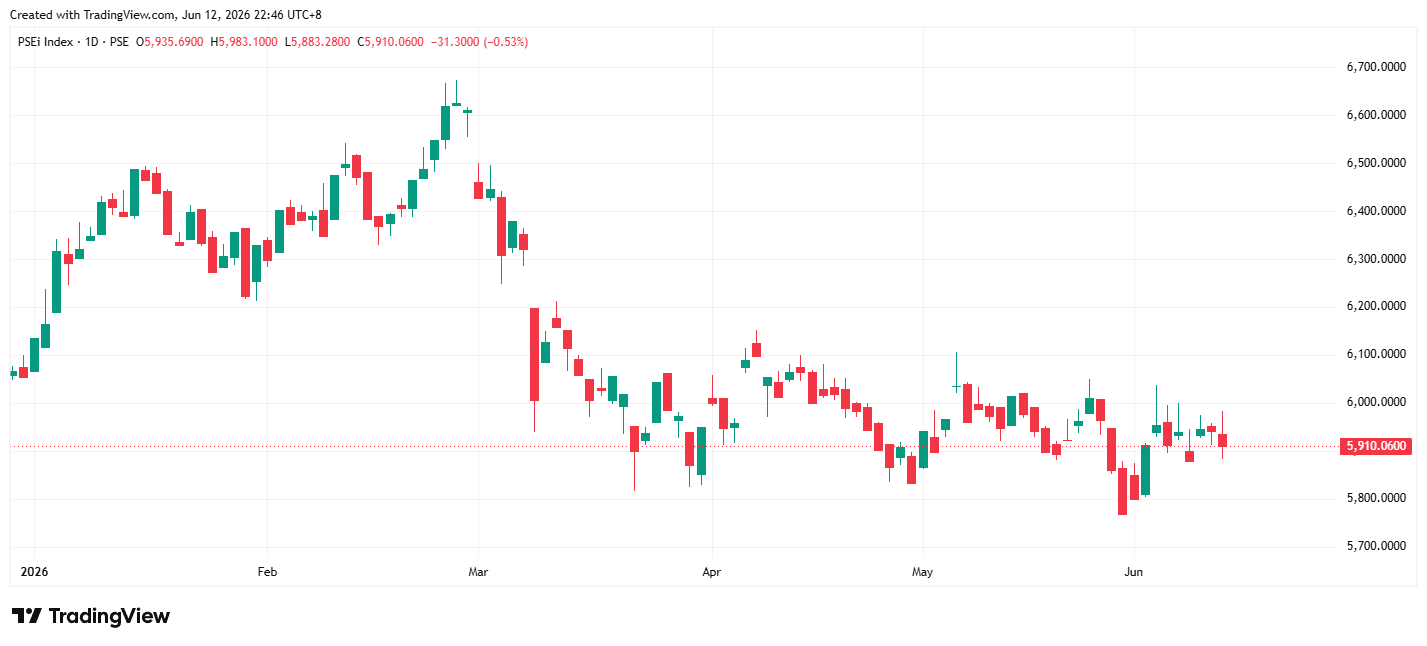
| PSEi | 5,910.06 | 31.30 | 0.53▼ |
| All Shares | 3,289.95 | 14.56 | 0.44▼ |
| Financials | 1,779.28 | 25.02 | 1.39▼ |
| Industrial | 8,270.77 | 29.37 | 0.35▼ |
| Holding Firms | 4,223.66 | 32.33 | 0.76▼ |
| Services | 3,187.09 | 13.89 | 0.44▲ |
| Mining and Oil | 15,667.23 | 1.12 | 0.01▲ |
| Property | 1,781.70 | 18.71 | 1.04▼ |
| MARKET : CLOSED | As of Jun 11, 2026 4:59 PM |
| Total Volume | 585,428,855 |
| Total Trades | 77,031 |
| Total Value | 6,651,792,939 |
| Advances | 75 |
| Declines | 99 |
| Unchanged | 59 |
| 更新: 6/11 | |
(6/17 10:06更新)
売買高は市場人気のバロメータだ。上位銘柄は流動性の高い銘柄といえる。このランキングに突然入ってきた銘柄には注意。何か特別な材料が出た可能性があるからだ。
平均売買高は43.03M株
| 銘柄名(シンボル) | 直近値 | 格付け | 売買高M | GCsignal |
| Ayala Corporation(AC) | 615 | ☆ | 1120.4255 | ▼ |
| Bank of the Philippine Islands(BPI) | 107 | ☆☆ | 1092.2432 | △ |
| BDO Unibank, Inc.(BDO) | 140 | ☆☆ | 612.9466 | △ |
| SM Prime Holdings, Inc.(SMPH) | 34 | ☆ | 594.4662 | ▼ |
| Ayala Land, Inc.(ALI) | 24.5 | ☆ | 550.319 | ▼ |
| SM Investments Corporation(SM) | 924 | ☆ | 482.7161 | ▼ |
| Metro Pacific Investments Corporation(MPI) | 4.38 | ☆ | 342.8708 | ● |
| International Container Terminal Services, Inc.(ICT) | 202 | ☆ | 335.3867 | ▼ |
| Universal Robina Corporation(URC) | 140 | ☆ | 325.0142 | ▼ |
| Metropolitan Bank & Trust Company(MBT) | 53.7 | ☆ | 294.8817 | ▼ |
| Jollibee Foods Corporation(JFC) | 240 | ☆ | 223.7352 | △ |
| PLDT Inc.(TEL) | 1260 | ☆☆ | 219.4353 | △ |
| Bloomberry Resorts Corporation(BLOOM) | 9.98 | ☆ | 191.3056 | ▼ |
| ACEN Corporation(ACEN) | 5.3 | ☆ | 167.3316 | ▼ |
| Globe Telecom, Inc.(GLO) | 1710 | ☆☆ | 164.9552 | △ |
| Robinsons Retail Holdings, Inc.(RRHI) | 54 | ☆ | 160.664 | △ |
| JG Summit Holdings, Inc.(JGS) | 49.4 | ☆ | 153.6636 | ▼ |
| Manila Electric Company(MER) | 336 | ☆☆☆ | 138.5933 | △ |
| Greenergy Holdings Incorporated(GREEN) | 1.38 | ☆ | 136.4917 | △ |
| Aboitiz Equity Ventures, Inc.(AEV) | 57.5 | ☆ | 121.4607 | ◎ |
(6/17 10:06更新)
配当利回りは実績での表示のため、異様に高い場合は注意が必要。業績の悪化が見込まれるか、何らかの理由で株価が急落しているようなときには総合的なパフォーマンスが悪化するケースもあるからだ。つねにランキングされている銘柄なら安心。
全銘柄では平均3.5%。主要30銘柄は2.58%。
| 銘柄名(シンボル) | 直近値 | 格付け | 配当% | GCsignal |
| GMA Network, Inc. | 8.68 | ☆ | 12.67 | △ |
| Shang Properties, Inc. | 2.83 | ☆☆☆ | 10.95 | ◎ |
| Del Monte Pacific Limited | 9.56 | ☆ | 9.93 | △ |
| Premium Leisure Corp. | 0.54 | ☆ | 9.3 | ▼ |
| City & Land Developers, Incorporated | 1.06 | ☆ | 8.7 | △ |
| DDMP REIT, Inc. | 1.28 | ☆ | 7.93 | ● |
| Synergy Grid & Development Phils., Inc. | 8.81 | ☆ | 7.89 | △ |
| Ionics, Inc. | 1.29 | ☆ | 7.75 | ▼ |
| Centro Escolar University | 7.84 | ☆☆ | 7.74 | ◎ |
| Citicore Energy REIT Corp. | 2.56 | ☆ | 7.34 | △ |
| PLDT Inc. | 1260 | ☆☆ | 7.14 | △ |
| Pilipinas Shell Petroleum Corporation | 14.4 | ☆☆☆ | 6.94 | ▼ |
| Filinvest Reit Corp. | 4.2 | - | 6.76 | ● |
| DMCI Holdings, Inc. | 9.21 | ☆☆ | 6.62 | ▼ |
| Manila Electric Company | 336 | ☆☆☆ | 6.56 | △ |
| Semirara Mining and Power Corporation | 27.6 | ☆☆ | 6.52 | ● |
| Asian Terminals, Inc. | 14.3 | ☆☆☆ | 6.34 | ◎ |
| Solid Group, Inc. | 0.96 | ☆ | 6.25 | ▼ |
| AREIT, Inc. | 34 | ☆ | 6.12 | ▼ |
| East West Banking Corporation | 7 | ☆☆☆ | 5.86 | ▼ |
(6/17 10:06更新)
PERは四半期決算の実績となっている。低PER銘柄は会社情報や最新ニュースなどで悪材料がないか確認する必要がある。何か問題を抱えている場合、業績が大幅に悪化する可能性もあるので、投資は見送る。問題のない会社なら割安となる。
全銘柄では平均14.45倍。主要30銘柄は13.91倍。
| 銘柄名(シンボル) | 直近値 | 格付け | PER | GCsignal |
| Philippine Infradev Holdings Inc. | 0.79 | - | 1.16 | ▼ |
| Anglo Philippine Holdings Corporation | 0.62 | ☆ | 1.19 | ◎ |
| Boulevard Holdings, Inc. | 0.073 | ☆ | 1.46 | ▼ |
| Empire East Land Holdings, Inc. | 0.158 | ☆ | 1.8 | ▼ |
| DDMP REIT, Inc. | 1.28 | ☆ | 1.91 | ● |
| Belle Corporation | 1.16 | ☆☆ | 2 | △ |
| Philippine National Bank | 18.72 | ☆☆☆ | 2.11 | ● |
| First Philippine Holdings Corporation | 61.1 | ☆ | 2.14 | ▼ |
| Benguet Corporation | 4.69 | ☆ | 2.21 | △ |
| A Brown Company, Inc. | 0.71 | ☆ | 2.54 | ▼ |
| Lopez Holdings Corporation | 4.35 | ☆☆ | 2.65 | △ |
| Vistamalls, Inc. | 2.68 | ☆ | 2.65 | ▼ |
| City & Land Developers, Incorporated | 1.06 | ☆ | 2.72 | △ |
| Cebu Landmasters, Inc. | 2.59 | ☆☆☆ | 2.76 | ▼ |
| East West Banking Corporation | 7 | ☆☆☆ | 2.77 | ▼ |
| Synergy Grid & Development Phils., Inc. | 8.81 | ☆ | 2.96 | △ |
| Asia United Bank Corporation | 45 | ☆☆☆ | 3.13 | ● |
| Shang Properties, Inc. | 2.83 | ☆☆☆ | 3.14 | ◎ |
| DMCI Holdings, Inc. | 9.21 | ☆☆ | 3.36 | ▼ |
| Vista Land & Lifescapes, Inc. | 1.68 | ☆☆ | 3.36 | ◎ |
(6/17 10:06更新)
PBRは実積による数値。PBR1倍以下は割安といわれるが、極端に低い場合は経営に問題があるケースもあるので、経営状況などを最新の会社情報で確認すること。
全銘柄では平均2.21倍。主要30銘柄は1.74倍。
| 銘柄名(シンボル) | 直近値 | 格付け | PBR | GCsignal |
| Premiere Island Power REIT Corporation | 1.5 | ☆ | 0.018 | △ |
| CTS Global Equity Group, Inc. | 0.8 | ☆ | 0.028 | ▼ |
| Top Frontier Investment Holdings, Inc. | 126.9 | ☆☆ | 0.059 | ▼ |
| Empire East Land Holdings, Inc. | 0.158 | ☆ | 0.079 | ▼ |
| Lopez Holdings Corporation | 4.35 | ☆☆ | 0.096 | △ |
| Panasonic Manufacturing Philippines Corporation | 5.6 | ☆☆☆ | 0.101 | △ |
| Waterfront Philippines, Incorporated | 0.42 | ☆ | 0.112 | ▼ |
| House of Investments, Inc. | 4.13 | ☆☆ | 0.138 | ▼ |
| Keppel Philippines Holdings, Inc. | 5.1 | ☆ | 0.141 | ▼ |
| Roxas and Company, Inc. | 0.48 | ☆ | 0.146 | ▼ |
| First Philippine Holdings Corporation | 61.1 | ☆ | 0.15 | ▼ |
| Bank of Commerce | 6.9 | ☆ | 0.156 | ▼ |
| Solid Group, Inc. | 0.96 | ☆ | 0.159 | ▼ |
| Philippine National Bank | 18.72 | ☆☆☆ | 0.185 | ● |
| Coal Asia Holdings Incorporated | 0.18 | ☆ | 0.189 | ▼ |
| National Reinsurance Corporation of the Philippines | 0.52 | ☆ | 0.19 | △ |
| Vista Land & Lifescapes, Inc. | 1.68 | ☆☆ | 0.191 | ◎ |
| Filinvest Land, Inc. | 0.71 | ☆☆ | 0.193 | △ |
| Century Properties Group, Inc. | 0.38 | ☆ | 0.202 | △ |
| Philippine Realty and Holdings Corporation | 0.14 | ☆ | 0.208 | ▼ |
(6/17 10:06更新)
前日比での出来高の増減。出来高が急増した銘柄では何か材料が出た可能性がある。
出来高増加は85銘柄 うち10倍以上になったのは6銘柄。減少は87銘柄。10分の1以下に減少したのは0銘柄。
| 銘柄名(シンボル) | 直近値 | 格付け | 出来高増減倍 | GCsignal |
| Phinma Corporation | 19.5 | ☆ | 267.97 | △ |
| Robinsons Retail Holdings, Inc. | 54 | ☆ | 154.61 | △ |
| A. Soriano Corporation | 11.3 | ☆☆ | 35.3 | △ |
| Arthaland Corporation | 0.49 | ☆ | 30.46 | ▼ |
| Asian Terminals, Inc. | 14.3 | ☆☆☆ | 25.56 | ◎ |
| AREIT, Inc. | 34 | ☆ | 12.88 | ▼ |
| 8990 Holdings, Inc. | 9.3 | ☆ | 9.26 | ▼ |
| Holcim Philippines, Inc. | 4 | ☆ | 8.76 | △ |
| Robinsons Land Corporation | 14.5 | ☆☆ | 8.71 | ▼ |
| A Brown Company, Inc. | 0.71 | ☆ | 7.81 | ▼ |
| Rizal Commercial Banking Corporation | 23.1 | ☆ | 7.76 | ▼ |
| Metro Pacific Investments Corporation | 4.38 | ☆ | 7.36 | ● |
| Aboitiz Equity Ventures, Inc. | 57.5 | ☆ | 7.26 | ◎ |
| JG Summit Holdings, Inc. | 49.4 | ☆ | 6.37 | ▼ |
| Cebu Landmasters, Inc. | 2.59 | ☆☆☆ | 6.04 | ▼ |
| Crown Equities, Inc. | 0.08 | ☆ | 5 | △ |
| Manila Mining Corporation | 0.009 | ☆ | 4.4 | △ |
| Lodestar Investment Holdings Corporation | 0.61 | ☆ | 3.94 | △ |
| PAL Holdings, Inc. | 5.4 | - | 3.81 | ▼ |
| Bank of the Philippine Islands | 107 | ☆☆ | 3.66 | △ |